Recently a client asked how do I change the default colours of the SQL Server Reporting Services 2005 (SSRS 2005) chart palette?
They wanted to know how to create the following pie chart palette:
- Completed - Lime Green
- Ready - Green Yellow
- In Progress - Yellow
- Not Progressed- Red
- Unknown - Blue
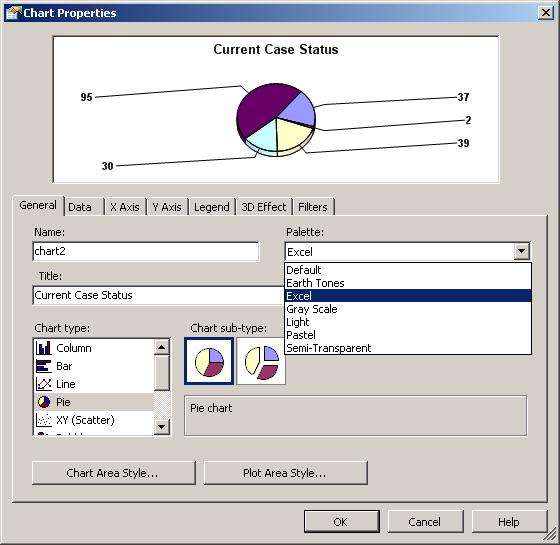
SQL Server Reporting Services 2005 chart object colour palette comes in seven flavours:
- Default
- Earth Tones
- Excel
- Gray Scale
- Light
- Pastel and
- Semi - Transparent
This causes an issue for developers who want and/or require more flexibility in the choice of colours for the chart colour palette.
One method would be to add some code to the report, defining the colour palette for the chart, and then applying the code.
An alternative method is to use the SWITCH function. The Switch function evaluates a list of expressions and returns an Object value corresponding to the first expression in the list that is True.
To create a custom palette based on the following values:
- Completed - Lime Green
- Ready - Green Yellow
- In Progress - Yellow
- Not Progressed- Red
- Unknown - Blue
- In the Layout Tab of SSRS 2005, add the Chart Object to the grid.
- Click and drag the required fields to the required chart locations
- Right Click on the Chart Object Select Properties option
This activates the Chart Properties dialog box:
- In the Chart Properties dialog box, click on the Data Tab
- Select the required field in the Values: section
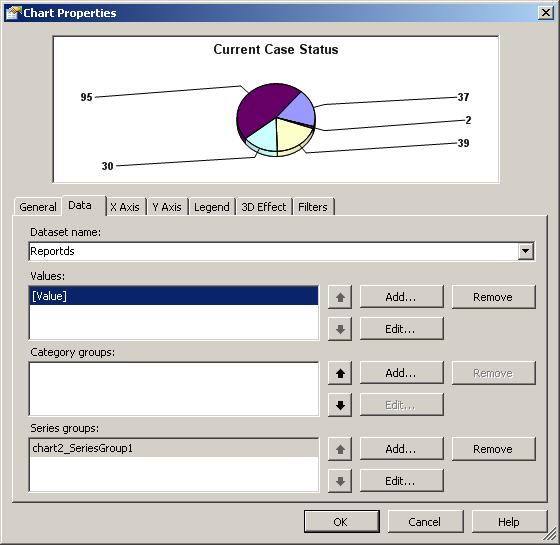
- Press the Edit button
- In the Edit Chart Value dialog box, select the Appearance Tab
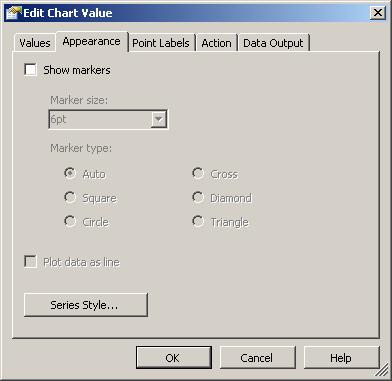
- Press the Series Style button
- In the Style Properties dialog box, select the Fill tab
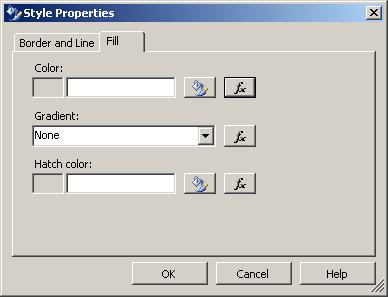
- Press the [fx] button
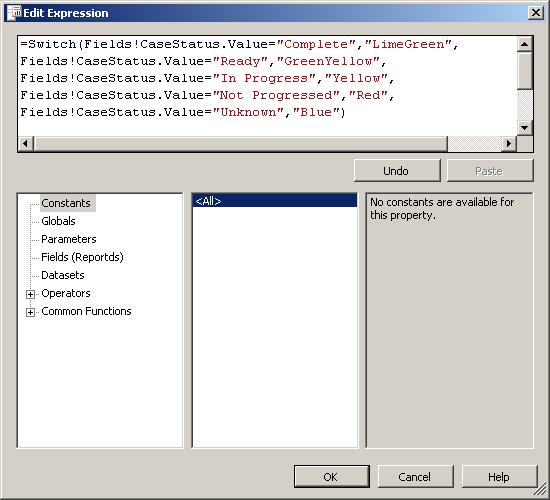
- In the Edit Expression dialog box enter the following formula:
=Switch(Fields!CaseStatus.Value="Complete","LimeGreen",
Fields!CaseStatus.Value="Ready","GreenYellow",
Fields!CaseStatus.Value="In Progress","Yellow",
Fields!CaseStatus.Value="Not Progressed","Red",
Fields!CaseStatus.Value="Unknown","Blue")
- Press the OK button
If you have any questions, or need any
assistance, please do not hesitate to Contact Us
|